Similar to the serial plotter on the Arduino Sketch IDE, there is a useful real-time serial plotter application at the Hackaday site. It is free and it offers configuration options that add to the utility of data tracking, measurement, and analysis. The application provides for scroll, zoom, cursor, channel selections, and color options that ease how visually parsed data is presented and managed. There is a range of capabilities with the utility that makes it a better way to go over the Sketch IDE data plotter.
While the link provided gives a way to download and install the latest data plotter version, this post makes use of the following file:
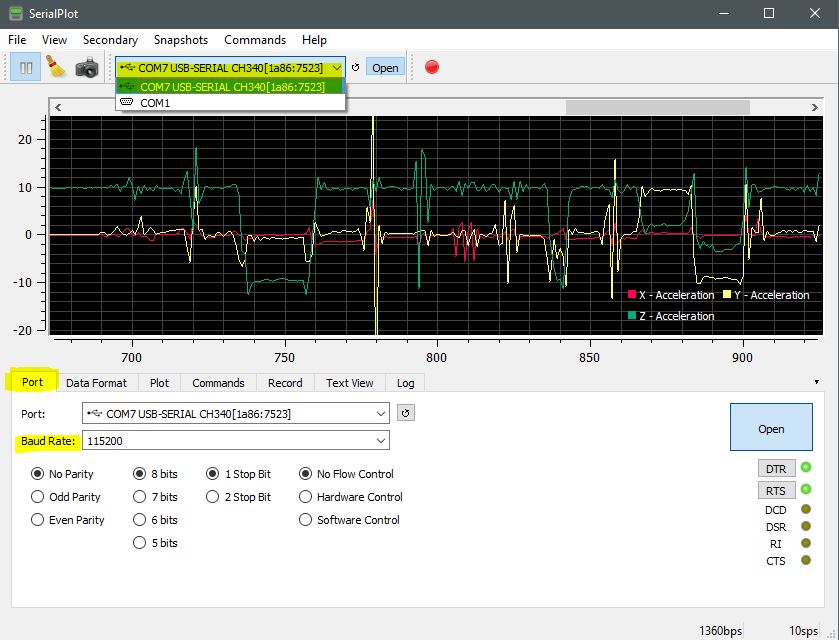
Once the utility is installed and running, there are configuration options I use to monitor the IMU serial data streams. Specifically, it is necessary to select the available COM port connected to the USB port on the Arduino host of the IMU module. Once that is done, the Baud Rate selected within the application’s Port tab must match the baud rate declared in the void setup() segment of your Arduino code. In this example, my declaration is Serial.begin(115200), so the baud rate selection must be 115200). The standard serial handshaking configurations apply as 8-bit, 1 stop bit, no parity, and no flow control.
It is important that the Arduino Sketch serial plotter application isn’t running as it will present a conflict with this utility.
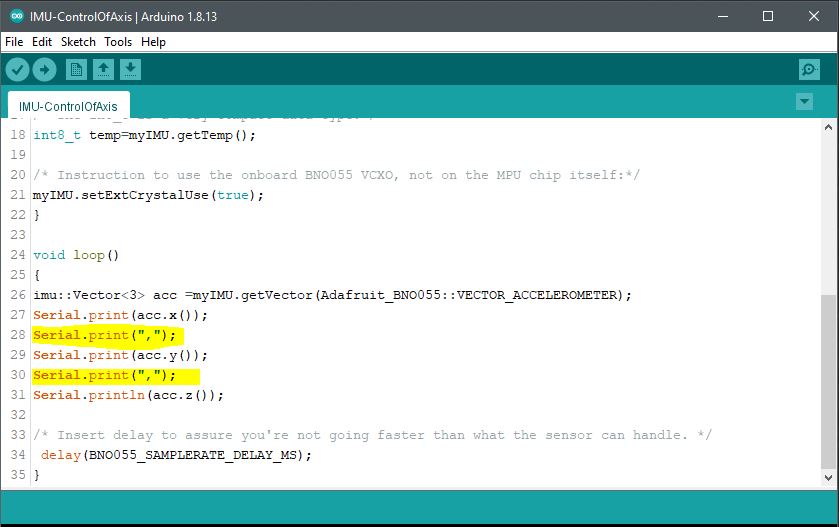
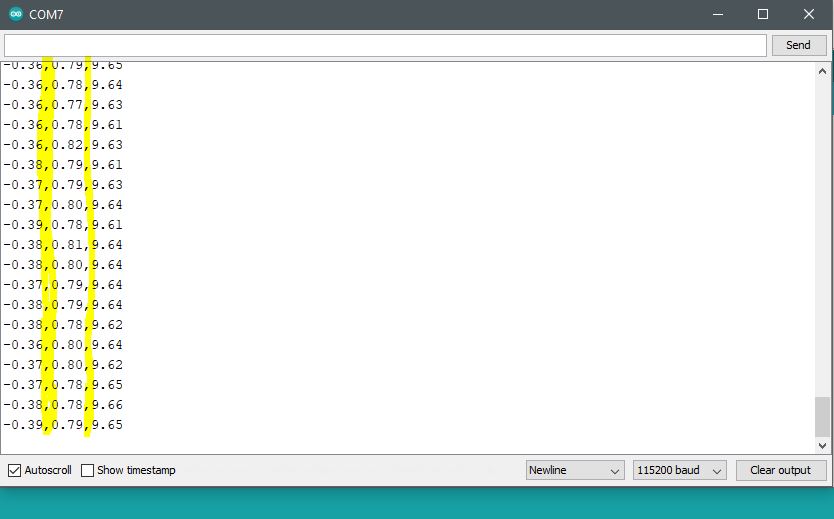
Next is formatting the data according to how the vector data acquisition code is written as an ASCII data type and for proper delimiting. Since the comma it used for data capture, that option is selected.
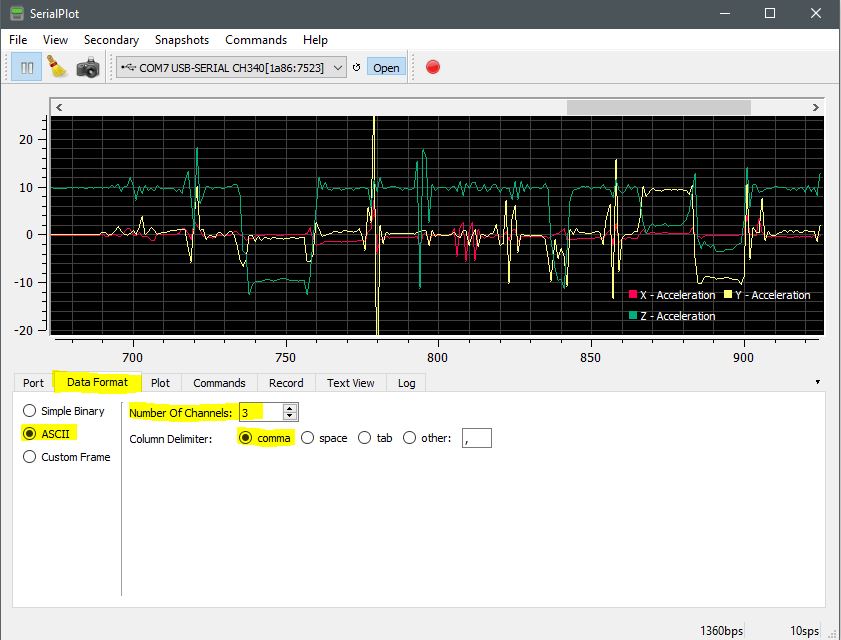
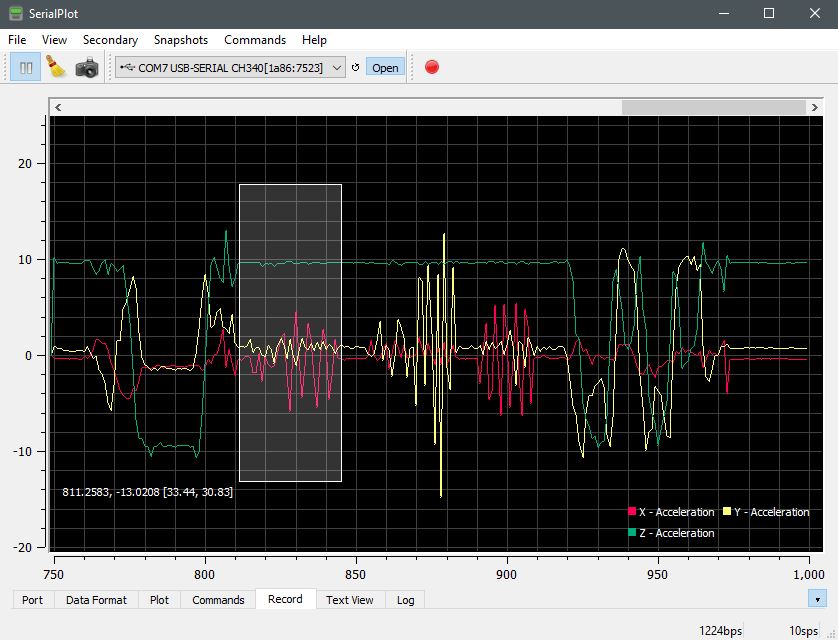
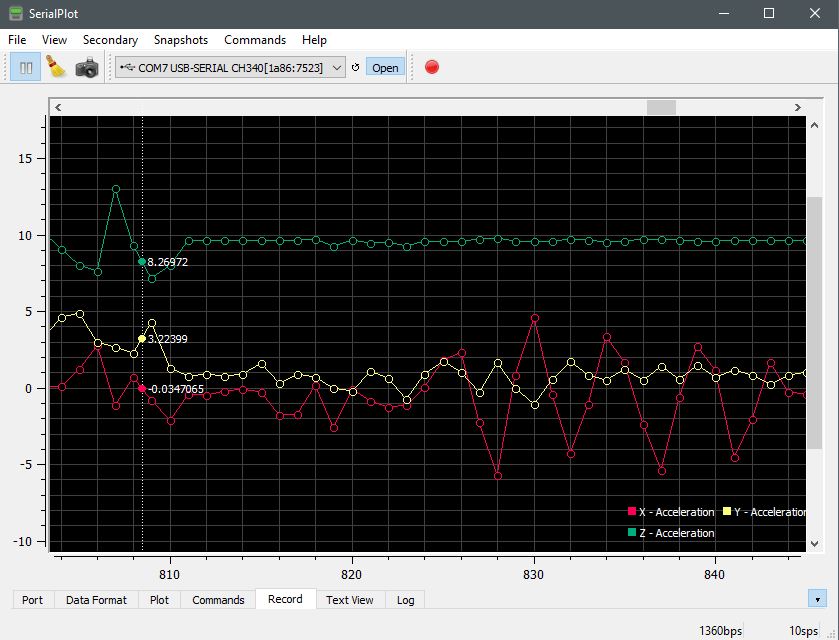
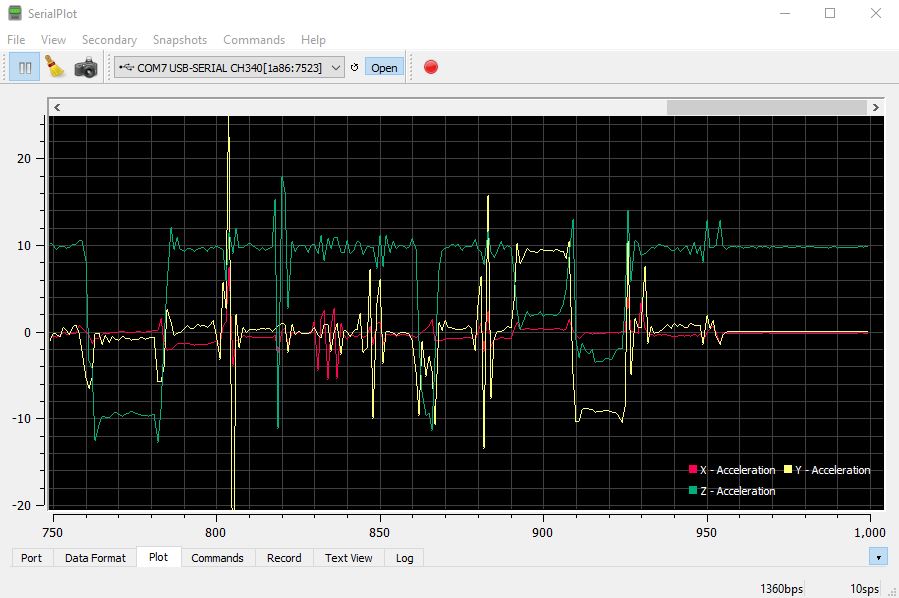
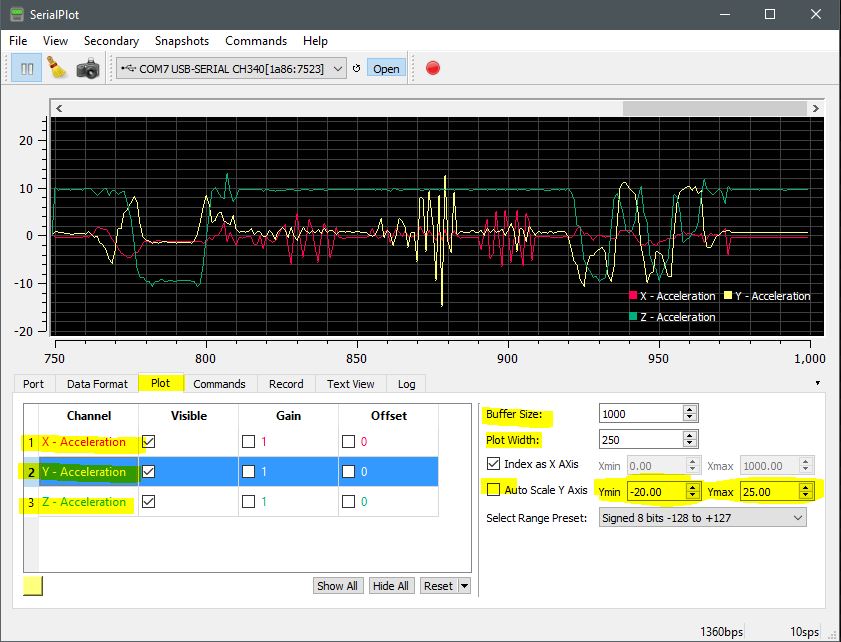
While the three acceleration vectors x, y, z automatically populated according to the number of channels in screen capture two (2) above. To add more channels (vectors), simply increase the quantity from the data format tab. The buffer size setting corresponds to the vector data held in memory and gets displayed along the x-axis in the plotter graph. Setting the plot width to a narrow data window increases the plotted data acquisition rate from right to left. The scale axis settings simply correspond to the amplitude of inflections observed in the data.
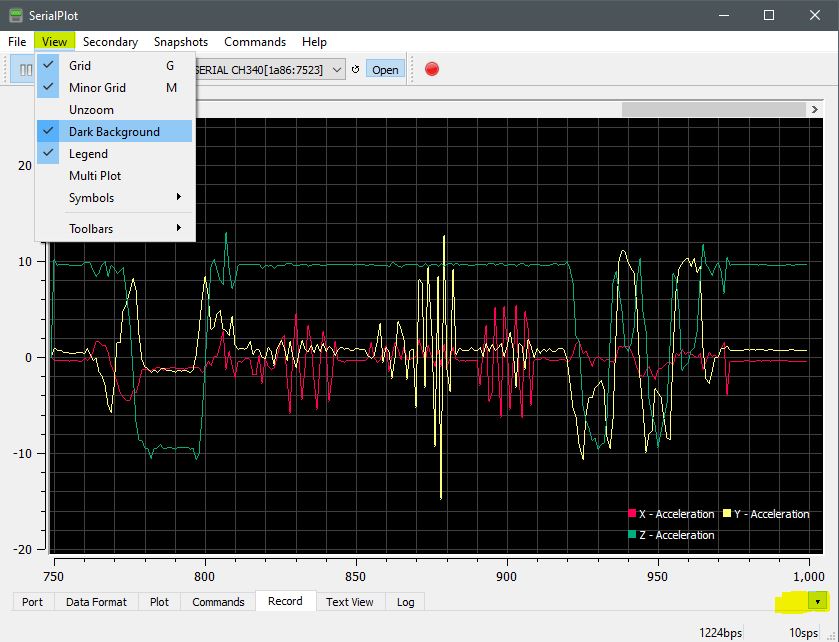
The other four tabs have less relevance in the set up here, but they are useful to record and monitor data as an output to acquired data. To further explore settings for visual quality and precision, experiment with the menu options to get your desired layout and format.